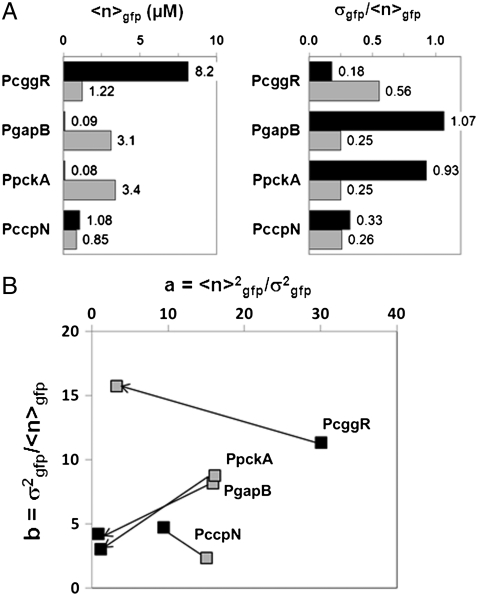
Fig. 3.
Changes in promoter activity levels and noise patterns upon a switch of carbon source. (A) The average number of GFPmut3 molecules per volex ( expressed in micromolar concentration) and its coefficient of variation (the standard deviation over the mean,
  ) in the cell populations grown on glucose (black bars) or malate (gray bars), estimated from the cell-based particles number distributions shown in Fig. 2B and considering a fixed auto-fluorescence background contribution as determined in the BSB168 receiver strain under identical experimental conditions. (B) Effect of nutrient switch on promoter activity noise patterns. The parameter of stochastic gene expression, the Fano factor b
  , related to GFP production burst size is plotted against a
  related to the GFP production burst frequency for the activity of the indicated promoters on glucose (black square) or malate (gray diamonds). The single arrows indicate the sense of repression for the regulated promoters.

