Fig. 5.
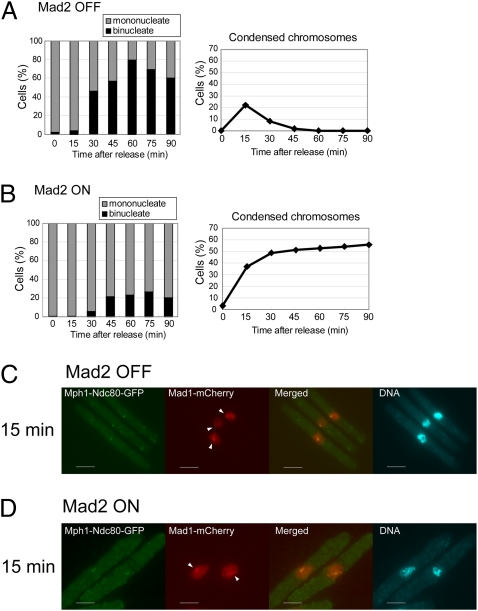
Localization of Mad1 in mitosis. (A and B) The percentages of the binucleate cells (Left) and cells with condensed chromosomes (Right) were determined after release from the arrest at the G2/M boundary. The cells were expressing Mad2 conditionally and Mph1-Ndc80-GFP from the native mph1+ locus. (C and D) Localization of Mad1-mCherry (red) was determined with Mph1-Ndc80-GFP expressed as in A and B 15 min after the release from the arrest at the G2/M boundary. Arrowheads indicate Mad1 foci colocalized with Mph1-Ndc80-GFP. DNA was visualized by staining with DAPI (4′-6-diamino-2-phenylindole). (Scale bars, 5 μm.) Fig. S4 shows images at other time points.

