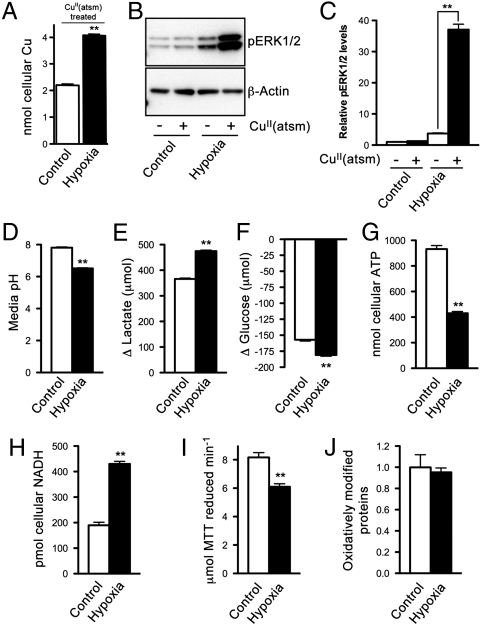
Fig. 2.
Effects of hypoxia on energy metabolism and cellular responses to CuII(atsm) in SH-SY5Y cells. (A) ICP-MS analysis of cellular Cu in normoxic control cells and hypoxic cells after treating with 10 μM CuII(atsm) for 1 h. (B) Western blotting image showing CuII(atsm) promotes phosphorylation of ERK1/2 (pERK1/2) in hypoxic cells. β-Actin levels are shown as a control. (C) Densitometry analysis of Western blotting results. (D) pH of media collected from cells after 2 d in culture. (E) Lactate produced and (F) glucose consumed by cells over 2 d in culture. (G) ATP and (H) NADH content of control cells and hypoxic cells. (I) Reduction of MTT mediated by cell lysates collected from control and hypoxic cells. (J) Relative content of oxidatively modified proteins in control cells and hypoxic cells. Data are mean values ± SEM, n = 3–6. Values shown in A and E–I are expressed per milligram cellular protein. P < 0.01 compared to control cells (t test) except for C where **P < 0.01 compared to vehicle-treated cells (ANOVA with Tukey’s posttest).

