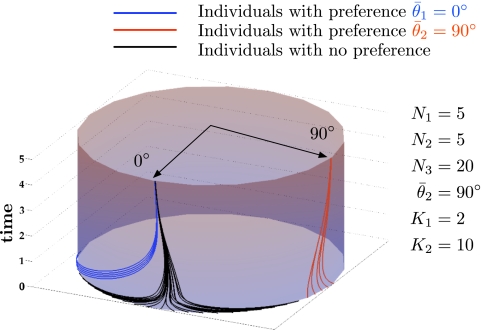
Fig. 2.
Simulation of dynamics of Eqs. 1–4 with N = 30 individuals, r = 0.9, and  and
and  as shown with black arrows on the top of the cylinder. The solution for each individual is shown evolving on the surface of the cylinder; the azimuth describes the angle θj and the vertical axis describes time t. For this example,
  and it can be observed that a decision is made for preference 1.

