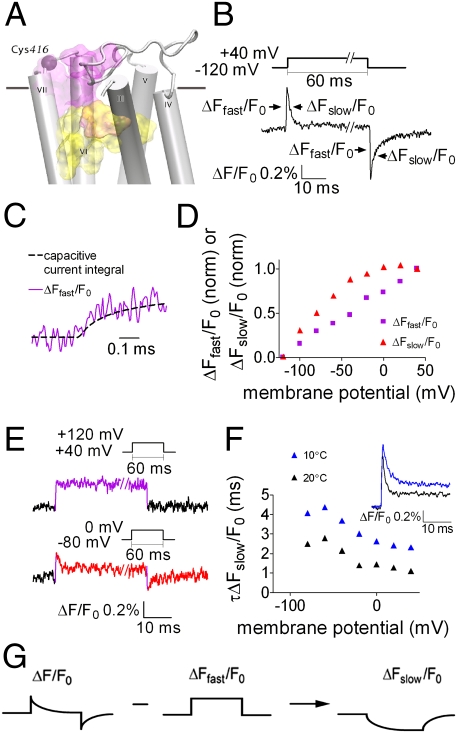
Fig. 1.
The voltage-dependent fluorescence signal of TMRM-Cys416 has two separable components. (A) Side view of the M2R. Indicated are: Cys416 (purple sphere) and the approximate locations of the orthosteric and allosteric binding sites (yellow and purple shades, respectively). The horizontal line represents the boundary between the extracellular solution and the lipid bilayer. TMI and TMII were omitted. (B) Representative fluorescence signal elicited by a depolarizing pulse; the pulse protocol is shown above. ΔFfast/F0 and ΔFslow/F0 are indicated with arrows. Here and in subsequent figures %ΔF/F0 indicates the percentage change in fluorescence relative to the background fluorescence. (C) ΔFfast/F0 follows the time course of the capacitive current integral. Data were sampled at 200 kHz and filtered at 20 kHz. Shown is a representative trace from one oocyte. n = 6 (here and below oocytes were taken from two or more batches). (D) (ΔFfast/F0) − V and (ΔFslow/F0) − V, calculated as described in Fig. S3, each normalized to its value at a step to +40, from one representative oocyte. Data were obtained using the same protocol as in B, but with steps in increments of 20 mV. (E) Representative traces of fluorescence signals from one oocyte. (Upper) Depolarizing pulse from +40 mV to +120 mV. (Lower) Depolarizing pulse from −80 mV to 0 mV. (Insets) Pulse protocol (n = 7). (F) (Inset) Representative fluorescence traces (from the “on” response) at 10 °C and 20 °C from one oocyte (n = 4). The time constant, τ, of ΔFslow/F0 (τΔFslow/F0) was extracted by fitting a single exponent to the decaying phase of the signal (see Materials and Methods). The plot shows the fitted values of τΔFslow/F0 obtained at various voltages from one oocyte at 10 °C and 20 °C. Pulse protocol was as in B. (G) The procedure to extract ΔFslow/F0.

