Fig. 3.
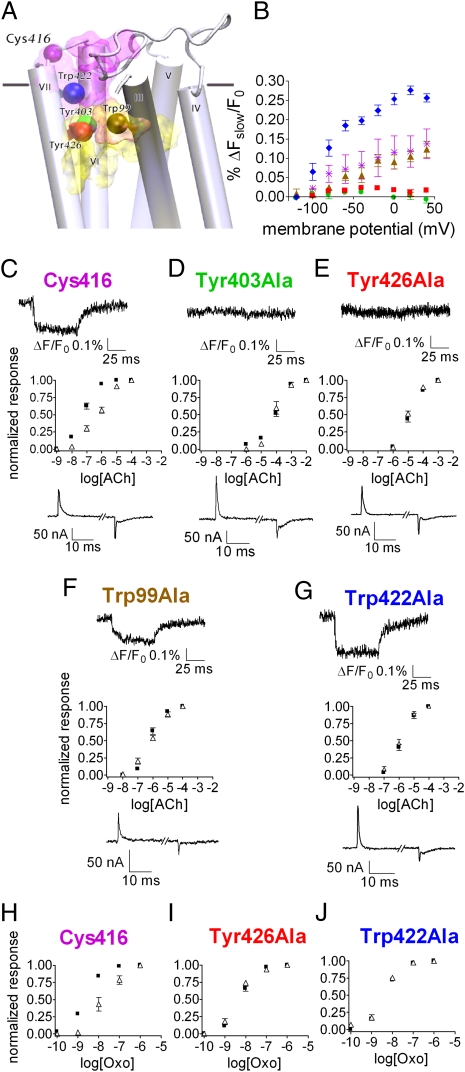
Effect of mutations in the orthosteric and allosteric binding sites on the fluorescence signal and on the voltage-dependent agonist binding. (A) Side view of the M2R model. Residue Cys416 and the mutated residues are shown as colored spheres (as identified in the figure) and the approximate locations of the orthosteric and allosteric binding sites are shown as yellow and purple shades, respectively. TMI and TMII were omitted. (B) (ΔFslow/F0) − V of the different mutants: Cys416, purple asterisks; Tyr403Ala, green circles; Tyr426Ala, red squares; Trp99Ala, brown triangles; Trp422Ala, blue diamonds. Each point shows mean ± SEM n = 2–5. (C–G) Dose-response curves of GIRK currents following ACh application of the various mutants at −80 mV (black squares) and +40 mV (open triangles). Each point shows mean ± SEM n = 3–7. (Upper Insets) Sample traces of ΔFslow/F0 from each mutant as indicted above each trace. (Lower Insets) Sample traces of gating currents, elicited by a depolarizing pulse, from −120 mV to +40 mV. (H–J) Dose-response curves of GIRK currents following Oxo application at −80 mV (black squares) and +40 mV (open triangles). (H) Cys416, (I) Tyr426Ala, (J) Trp422Ala. Each point shows mean ± SEM n = 3–10.

