Fig. 6.
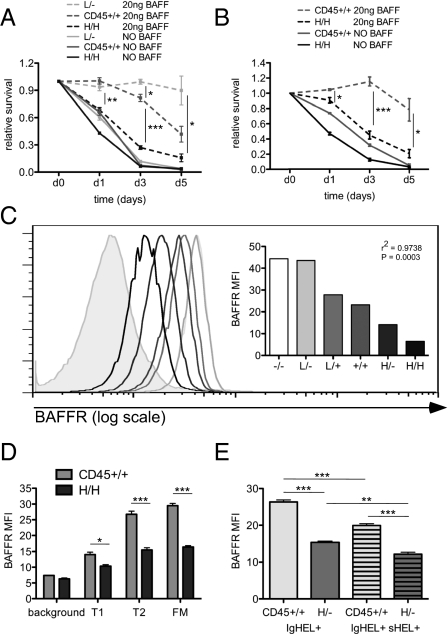
High CD45 expression renders B cells refractory to BAFF. (A) L/−, CD45+/+, and H/H LN B cells were incubated in media with or without 20 ng/mL of BAFF for 5 d. Viability of allotype-marked CD23+ follicular LN B cells was assessed at d0, d1, d3, and d5 by flow cytometry. The graph represents viable B cells of each genotype normalized to starting viability. Values are mean ± SEM of three biological replicates. (B) CD45+/+ and H/H LN B cells from mixed chimeric mice were assayed for survival as described in A to isolate cell intrinsic contributions to this assay. Values are mean ± SEM of three biological replicates. (C) Histograms representing BAFFR expression on CD23+ (T2 and FM) splenic B cells from allelic series mice. Gray shading represents background staining of non–B-cell splenocytes. BAFFR MFI of distinct histograms is plotted on the right. Data are representative of three independent experiments. (D) CD45.1 (H/H) and CD45.2 (WT) splenic B cells from mixed chimeras stained for allotype markers and expression of BAFFR, CD23, and AA4.1 to identify the cell intrinsic contribution of each genotype to BAFFR expression at sequential B-cell developmental stages. The graph shows MFI of BAFFR surface expression on T1, T2, and FM subsets (gated as in SI Appendix, Fig. S1C) in H/H (45.1) and WT (45.2) splenocytes from mixed chimeras. Background staining is defined by BAFFR staining of non–B-cell splenocytes and is plotted for reference. Values are mean ± SEM of three biological replicates. (E) Graph representing MFI of BAFFR surface expression in CD23+ splenocytes from IgHEL+ CD45+/+ and IgHEL+ H/− mice with or without autoantigen (sHEL) expression. Values are mean ± SEM of three biological replicates.

