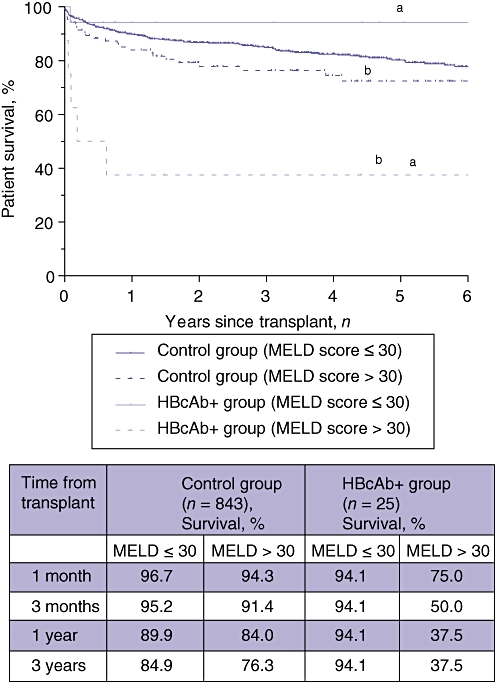
Figure 3.

Kaplan–Meier overall survival curves for recipients of hepatitis B core antibody-positive (HBcAb+ group) and HBcAb− (control group) organs stratified according to actual Model for End-stage Liver Disease (MELD) scores at surgery. Statistical analysis using the log-rank test indicated a significant difference between survival curves. Recipients of HBcAb+ grafts with high MELD scores had worse outcomes. aP = 0.003; bP = 0.002
