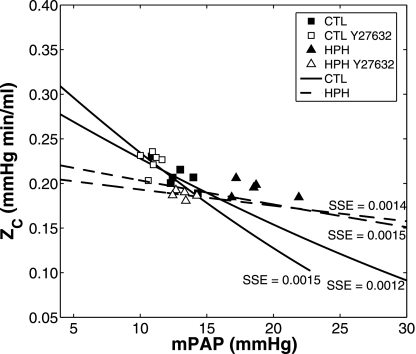
Fig. 6.
Characteristic impedance (ZC) as a function of mPAP for CTL (n = 6; □ and ■) and HPH (n = 5; ▴ and ▵) mouse lungs in a baseline SMC tone state and with Y27632 (white). The extrema of the solution spaces for the theoretical ZC-mPAP relationships are shown by the bounding areas for CTL (solid lines) and HPH (dashed lines). Sum of squared error (SSE) for each model fit to experimental data is shown.

