
Figure 2.
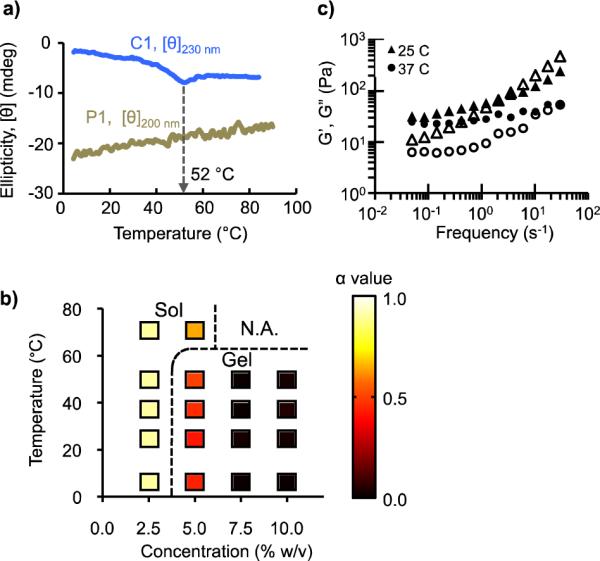
Hydrogel formation as a function of temperature. (a) Thermal stability of C and P domains monitored by circular dichroism (CD) at 230 nm and 200 nm, respectively. (b) Sol-gel phase diagram based on microrheology. The dotted lines were drawn as a visual guide to delineate sol formulations (α > 0.55) from gel formulations (α < 0.55). (c) Bulk oscillatory rheology of C7:P9 (10.0% w/v), showing storage (G', closed symbols) and loss (G”, open symbols) moduli.