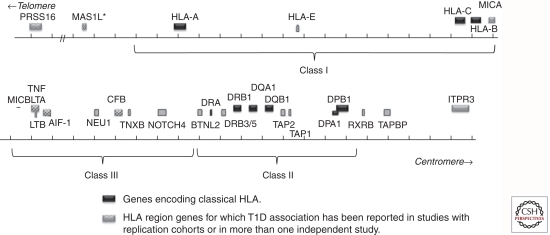
Figure 1.
Schematic representation of selected genes in the HLA region. Classical HLA genes are shown in black. Other T1D-associated genes are shown with patterned boxes. Gray boxes show genes not reported to be T1D-associated. Approximate boundaries of class I, class III, and class II regions are indicated by brackets.

