
Figure 5.
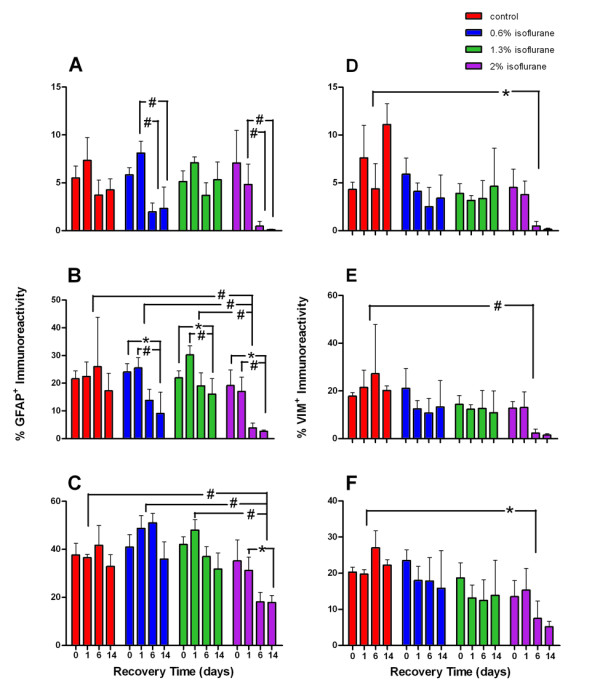
Quantification of percent GFAP+ and percent VIM+ areas in the dentate gyrus granule layer, hilus, and hippocampal molecular layer at different anesthetic concentrations over days of observation. Red, blue, green, and purple bars represent control, 0.6%, 1.3%, and 2% isoflurane exposure groups, respectively. Depicted are percentage of GFAP+ immunoreactivity in the granule layer (A), hilus (B), and hippocampal molecular layer (C) and percentage of VIM+ immunoreactivity in the granule layer (D), hilus (E), and hippocampal molecluar layer (F). Notice the marked reduction in GFAP and VIM at later time points especially at the higher concentration of isoflurane. *, p < 0.05; #, p < 0.01.