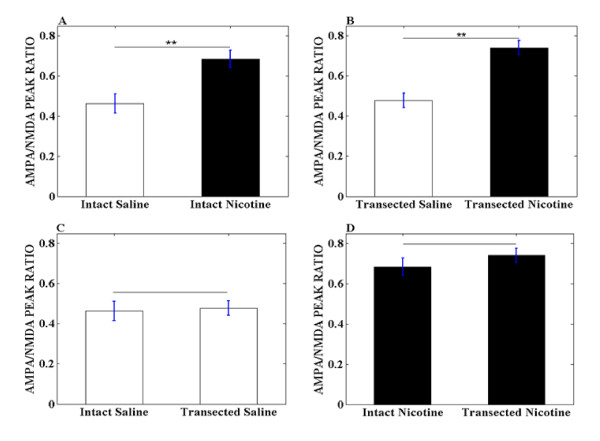
Figure 3.
Summary of AMPA/NMDA peak ratios obtained from rats with different treatments. (A) Summary of AMPA/NMDA peak ratio obtained from rats treated with saline and nicotine with PFC intact (** indicates p < 0.01). (B) Summary of AMPA/NMDA peak ratio obtained from rats treated with saline and nicotine with PFC transected (** indicates p < 0.01). (C) Summary of AMPA/NMDA peak ratio obtained from rats treated with saline with PFC intact and PFC transected. (D) Summary of AMPA/NMDA peak ratio obtained from rats treated with nicotine with PFC intact and PFC transacted.

