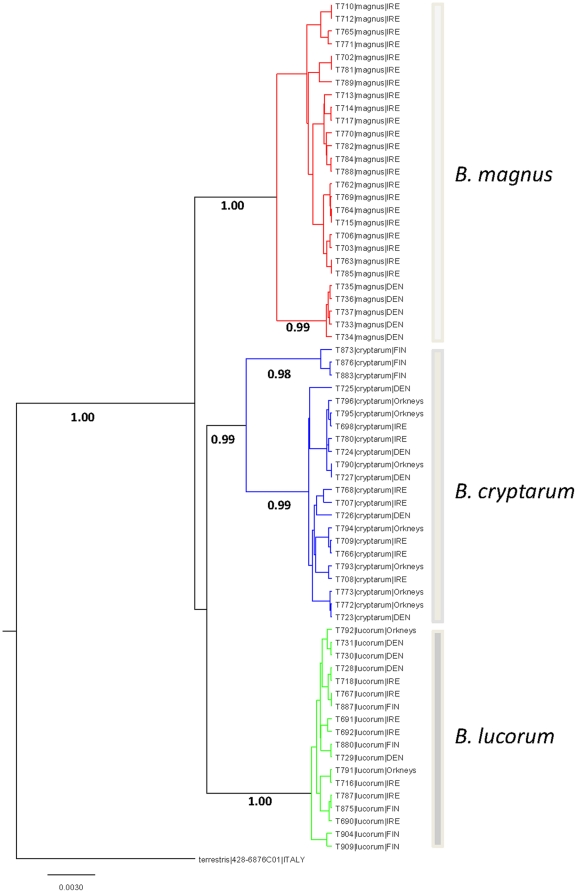
Figure 1. Consensus Bayesian tree generated from 642 bps of the mitochondrial COI region for 67 representatives of the lucorum complex.
Bayesian MCMC analysis was conducted using the general time reversible model, gamma distribution and 1 million generations. Numbers below the branches indicate posterior probabilities. Scale bar relates to expected number of substitutions per site. B. terrestris (428–6876COI) was included as an out-group and used to root the trees.

