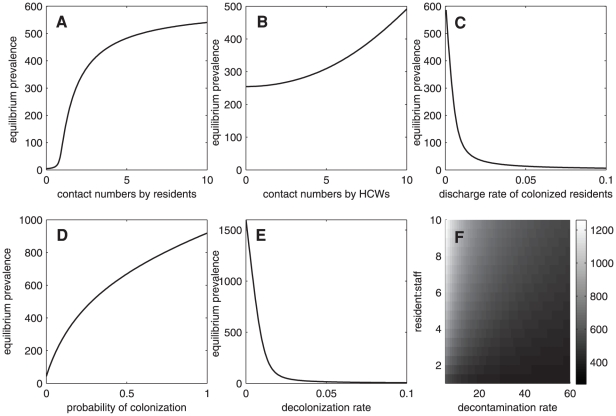
Figure 3. Prevalence of MRSA.
Prevalence of MRSA in nursing homes at the steady states (from the deterministic model) as a function of the average number of contacts among residents (A), the average number of contacts that each resident requires (B), the discharge rate of colonized residents (C), probability of colonization at admission (D), rate of decolonization (E), and the decontamination rate and the resident∶staff ratio (F) ( ).
).

