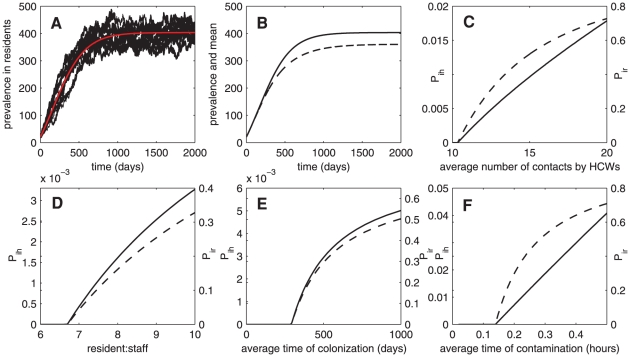
Figure 5. Stochasticity.
(A) Time series for the deterministic and stochastic models showing the prevalence of MRSA colonization (examples of 10 from 5000 realizations)( ). (B) Comparison between the deterministic time series and the mean solution from the equations of mean, variance, and covariance (
 -solid trace and
  -dash trace). (C)–(F) Invasion probability of MRSA according to the changes of the average number of contacts between residents and HCWs, the resident∶staff ratio, the period of contamination time in HCWs, and the period of colonization time in residents, respectively (
 -solid trace and
  -dash trace)(for
  , we set
  ).
).

