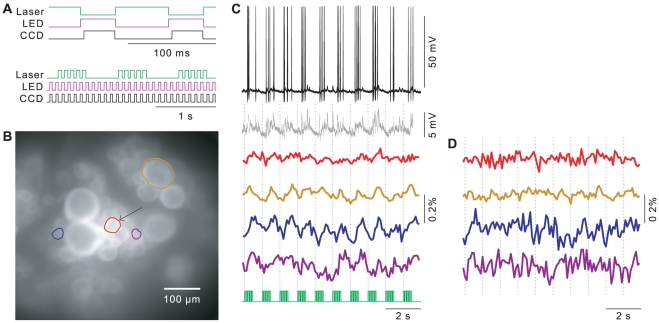
Figure 4. Real-world test of the LED light source.
A. Timing diagram of visual stimuli delivered to peripheral sensilla (“Laser”), excitation light for voltage-sensitive dyes (“LED”) and frame acquisition by the two CCD cameras (“CCD”), at the short time scale of single frames (top) and the longer time scale of effective light stimuli (bottom). B. Fluorescence micrograph of a leech ganglion (detail) with several cells indicated. The arrow indicates a neuron known as the “S” cell. C. Intracellular recording (black) from the S cell, same data with action potentials digitally removed (gray), and simultaneously recorded ratiometric VSD fluorescence from the S cell (red) and the other cells circled in (B). Timing of the visual stimuli is indicated in green. D. VSD signals after addition of synthetic noise to simulate recording conditions with a halogen lamp.

