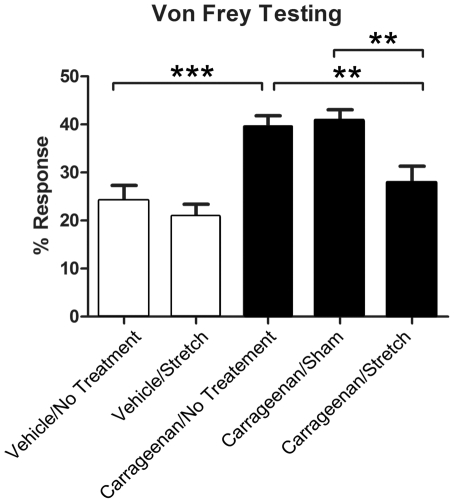
Figure 3. Von Frey filament testing for mechanical sensitivity in the low back.
Bar graphs illustrate the mean percentage response out of ten trials for each experimental group at two weeks with the 1 g filament. Open and closed bars respectively represent means ±S.E for vehicle and carrageenan groups. For each group, the average response at two weeks was adjusted for baseline Von Frey measurements. N = 4 carrageenan/sham, N = 8 all other groups. (**p<.01, ***p<.001).

