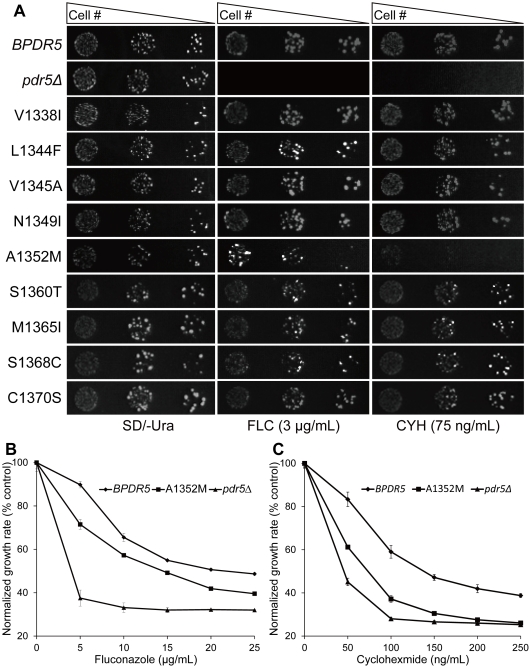
Figure 2. Drug resistance profiles of cells expressing PDR5 variants.
(A) Nine mutated sites distributed throughout blocks S2A and S2B were separated by site-directed mutagenesis and fluconazole sensitivities of mutant variants were determined by spot assay. Cells were grown overnight and reinoculated to OD600 = 0.1, then 4 µL of five-fold serial dilutions were spotted onto drug free or drug containing (3 µg/mL fluconazole or 75 ng/mL cycloheximide) SD/-Ura plates. The plates were incubated at 30°C for 72 hours. (B) Resistance of BPDR5 (⧫), pdr5Δ (▴) and A1352 (▪) mutants to increasing concentrations of fluconazole. Cells from overnight cultures were inoculated to OD600 = 0.1. Growth was estimated on the basis of OD600 and plotted as percentage growth, where the growth in drug free media was taken to be 100%. The mean values of three independent experiments are plotted and the error bars represent the S.D. (C) Growth of BPDR5 (⧫), pdr5Δ (▴) and A1352 (▪) mutants was compared as described in B, except that the experiment was performed in the presence of increasing concentrations of cycloheximide.

