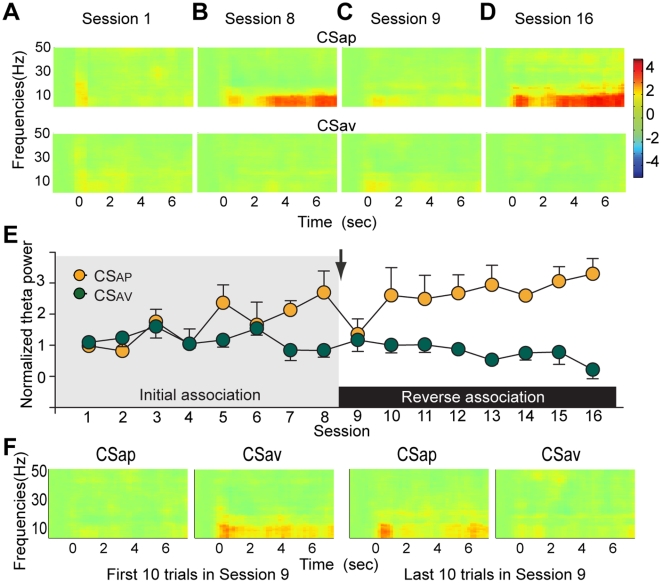
Figure 4. Change in LFP power pooled across subjects.
(A–D) Spectrograms aligned to CSAP and CSAV and data depict group average baseline (−1.5–0 sec before CS) normalized power per frequency bin according to the color scale at the right. Frequencies between 0.7 and 50 Hz are displayed with top row representing CSAP and bottom row representing CSAV. (E) Change in theta power (4–8 Hz) during a 4 second window aligned to each CS onset. Data are depicted as mean + SEM in each session. The initial associations (pre-reversal) were presented during sessions 1–8 and are depicted with the grey background. The reversed association was presented during session 9–16 and is depicted with the white background. The arrow marks the reversal and the color legend is depicted in the upper left corner. As the most prominent changes in LFP oscillations were in the theta range, we more closely examined the normalized power of theta band oscillations. (F) Changes in LFP power within the session 9. Data in each spectrogram are depicted as the average over the first 10 trials. Similar format and same color scale as (A–D). The CSAP and CSAV were reversed in session 9. Spectrograms of the first 10 trials of CSAP and CSAV delivery showed opposite patterns as the pre-reversal sessions, indicating that power modulations were not tracking the reversal in associations (left). In the last 10 trials, the new CSAP evoked an increase in power while the new CSAV modulated power in a similar fashion as pre-reversal sessions, indicating the power modulations were now tracking the reversal of associations.

