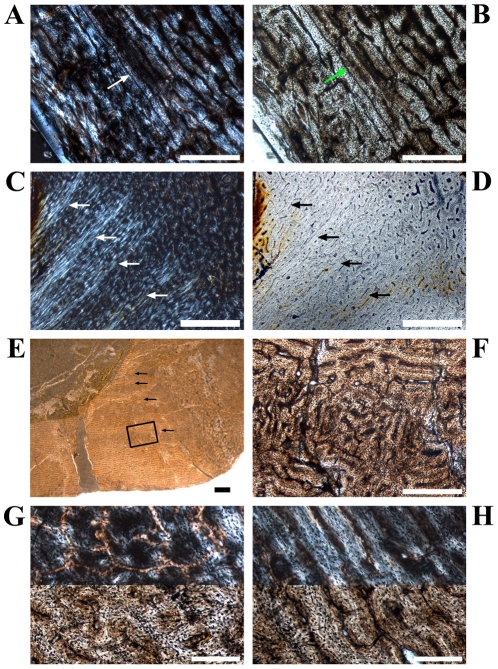
Figure 5. Growth cycles in Dysalotosaurus femora.
A–B: GPIT/RE/3587, A – The outer edge of the posterior bone wall with mainly circumferential primary osteons and a LAG (arrow), under polarized light. B – The same as in A under normal light. C–D: GPIT/RE/3414, C – Interior part of the posterolateral bone wall under polarized light. The growth cycles (fast growing zones darker, slow growing zones brighter) stop at the Posterolateral Plug. Arrows indicate the outer edge of a slow growing zone. D – The same as in C under normal light. The growth cycles are now very difficult to identify. The best verifiable slow growing zones are the second and third where the outer edge is less vascularized and the circumferential orientation of canals is significant. E–H: GPIT/RE/3588, E – Posterolateral corner under normal light with the typical alternation of fast (darker) and slow (brighter) growing zones. The external edge of the slow growing zones is marked by arrows. Note the transition of the internal cyclicity to an almost uniform slow growing zone externally (border at the lower edge of the frame). F – Magnification of the section framed in E showing the strong organizational difference between primary osteons of the fast growing zone (center) and the slow growing zones (top and bottom). G – Close up of a fast growing zone both under polarized and normal light. The image is slightly rotated in comparison to E and F. H – Close up of a slow growing zone both under polarized and normal light. The image is slightly rotated in comparison to E and F. Scale bars = 1 mm in C–E. Scale bars = 500 µm in A–B, F. Scale bars = 200 µm in G–H.

