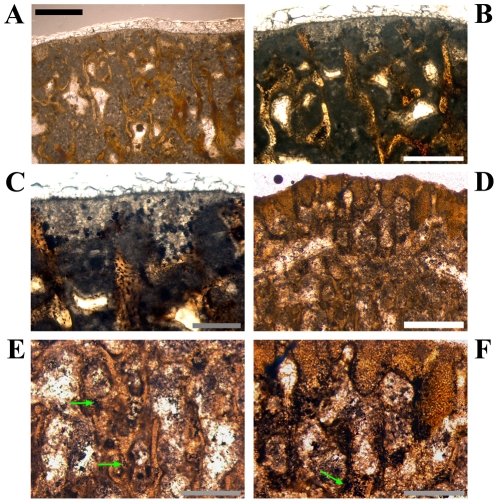
Figure 7. Upside down images of longitudinal sections of the distal ends of two femora.
A–C: large specimen GPIT/RE/3518, A – Overview under normal light. The foam-like patches at the distal (here upper) edge consist of calcified cartilage partially divided by trabecular bone. B – Magnification of the upper centre of A under normal light. C – Magnification of the upper centre of B under normal light. The bubbles of calcified cartilage cells are well distinguishable from the osteocyte lacunae within the trabecular bone. D–F: Small specimen GZG.V 6379, D – Overview under normal light. The pads of calcified cartilage reach deeper into the specimen than in A. Trabecular bone is well ossified in the lower centre but there are already centres of ossification close to the distal (here upper) surface. E – Magnification of the lower centre of D. Isolated clusters of calcified cartilage are still present (arrows). F – Magnification of the upper centre of D showing trabecular bone under development and isolated remains of calcified cartilage within bone (arrow). Scale bars = 1 mm in A, D. Scale bars = 500 µm in B, E–F. Scale bars = 200 µm in C.

