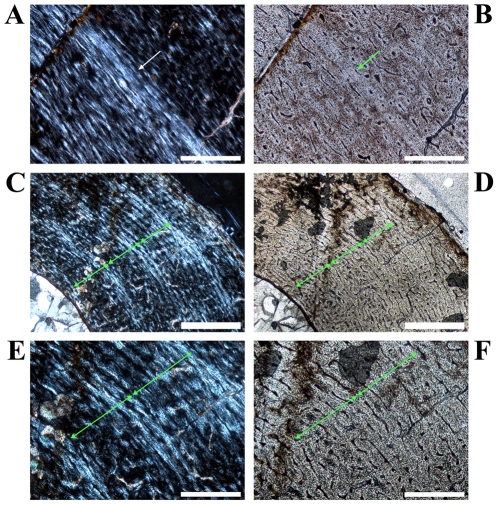
Figure 10. Growth cycles in Dysalotosaurus tibiae.
A–B: Large tibia SMNS T3, A – Close up of the anterior bone wall with a slow growing zone flushing externally with an annulus (arrow) and a LAG (at the internal edge of the former), under polarized light. B – The same as in A under normal light. The arrow marks again the annulus. The LAG is visible as up to two thin lines at its internal edge. C–F: Smaller tibia GPIT/RE/3724, C – Anteromedial corner under polarized light with up to five slow growing zones. The three middle growth cycles, consisting of a fast and a following slow growing zone, are completely visible (marked by three double-headed arrows). Whether the utmost slow growing zone is complete or not cannot be verified. D – The same as in C under normal light. Fast and slow growing zones are again difficult to distinguish. Apart from using polarized light, only minor differences in the organization of primary osteons are visible. E – Magnification of C with the two external arrows included. F – Magnification of D with the two external arrows included. Scale bars = 1 mm in C–D. Scale bars = 500 µm in A–B, E–F.

