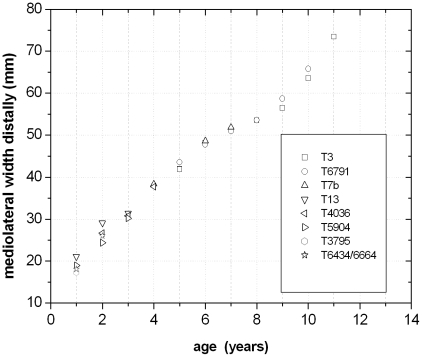
Figure 17. Fractional growth cycle values of tibia group one are correlated to age.
‘T’ is the abbreviation for ‘tibia’. Each of the following numbers corresponds to the respective specimens in Tab. 2. Some specimens were sampled at least twice so that additional letters (b) advert to the respective section used for this correlation.

