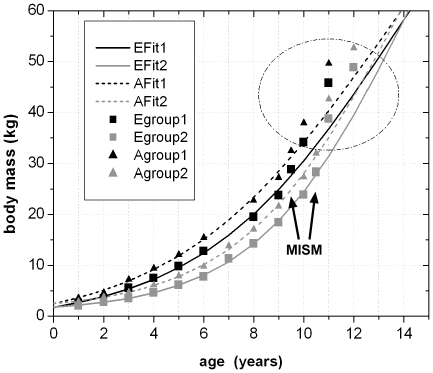
Figure 19. The nine correlated growth cycle values of femur group one and two were combined with the values of the MISM and were used for the calculation of four growth curves.
All encircled values represent unsecured growth cycles external to the MISM and were plot into the diagram afterwards. The shift of these points onto their respective growth curves resulted in a graphical change of only one additional year in age in average. Thus, 13 years are finally represented by all visible growth cycle values. Abbr.: EFit1 – Growth curve of femur group one, calculated with body masses derived from Erickson & Tumanova [27]; EFit2 – Growth curve of femur group two, calculated with body masses derived from Erickson & Tumanova [27]; AFit1 – Growth curve of femur group one, calculated with body masses derived from Anderson et al. [64]; AFit2 – Growth curve of femur group two, calculated with body masses derived from Anderson et al. [64]; Egroup1 – Correlated fractional growth cycle values of femur group one, the respective body masses are derived from Erickson & Tumanova [27]; Egroup2 – Correlated fractional growth cycle values of femur group two, the respective body masses are derived from Erickson & Tumanova [27]; Agroup1 – Correlated fractional growth cycle values of femur group one, the respective body masses are derived from Anderson et al. [64]; Agroup2 – Correlated fractional growth cycle values of femur group two, the respective body masses are derived from Anderson et al. [64].

