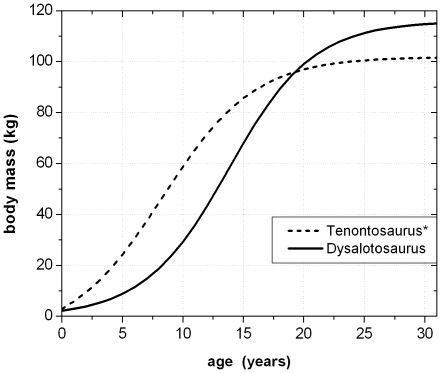
Figure 24. Comparison of growth curves of Tenontosaurus tilletti (derived from table 2 in [62]) and Dysalotosaurus lettowvorbecki.
*Note that the maximum body mass of Tenontosaurus is app. ten times higher than in Dysalotosaurus. Thus, for a better comparison, the body mass values of Tenontosaurus were divided by 10 and then used for the growth curve calculation.

