
Figure 2.
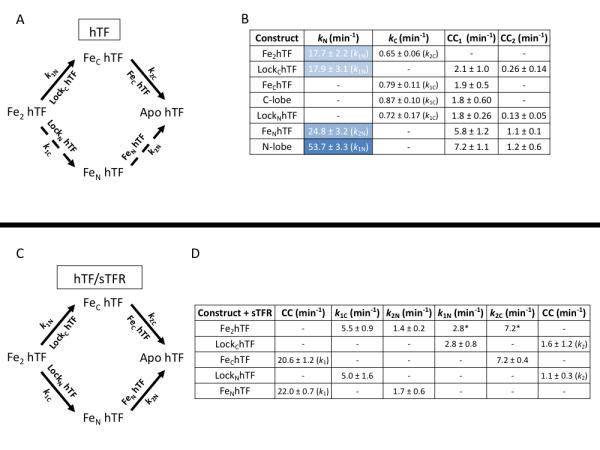
Kinetics of iron release at pH 5.6 from hTF ± sTFR. (A) Iron release in the absence of the sTFR. The primary pathway of iron release is indicated as solid arrows while the alternative pathway is indicated as broken arrows. Specific constructs used to isolate the rates are indicated by the arrows. (B) Rates of iron release from various hTF constructs. Rates of iron release from the N-lobe are highlighted in blue (differing shades are utilized to highlight the cooperativity of the N-lobe). Conformational changes (CC1 and CC2) that occur following iron release are also reported. (C) Iron release in the presence of the sTFR. (D) Rates of iron release from hTF/sTFR complexes. As previously reported [62], all values are rate constants ± errors at the 95% confidence interval and are averages of multiple kinetic runs. *k1N and k2C are held fixed at the values for LockChTF and FeChTF, respectively, during fitting of Fe2hTF/sTFR data.