
Figure 3.
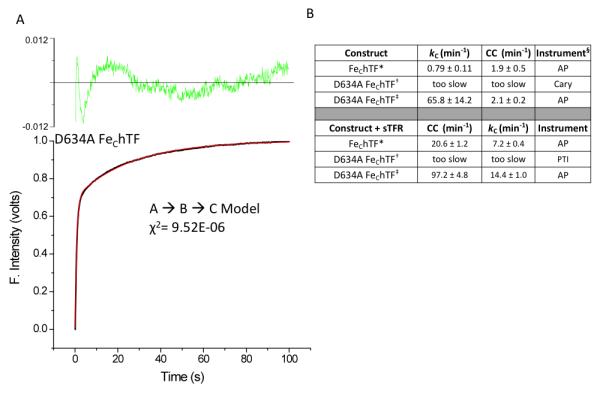
Effects on iron release when Asp634 is mutated to alanine. (A) Normalized iron release curve from the D634A FeChTF mutant (black line) and fit (red line). The residuals are indicated (green). (B) Values for iron release and conformational changes are reported as averages ± 95% confidence intervals. * From [62]. † From [17]. ‡ Previously unpublished results. § Measurements were carried out using a Varian Cary 100 dual beam spectrophotometer (Cary), a Photon Technology International QuantaMaster (PTI) spectrofluorometer, or an Applied Photophysics (AP) SX.18MV stopped-flow spectrofluorometer as indicated.