
Figure 5. Mitochondrial NADH Level Decreased during Malate-Aspartate Shuttle Inhibition.
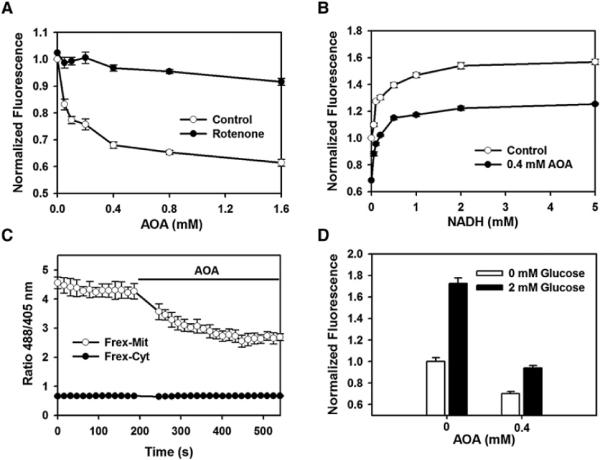
(A) Fluorescence response of Frex-Mit-expressing cells excited at 485 nm in the presence of different concentrations of the malate-aspartate shuttle inhibitor AOA. Rotenone blocked the decrease of mitochondrial NADH level induced by AOA. Cells were treated with inhibitors for 20 min. Error bars represent SEM.
(B) AOA blocked the entry of exogenous NADH into mitochondria. Fluorescence responses of glucose-starved, Frex-Mit-expressing cells excited at 485 nm were measured 60 min after addition of 0.4 mM AOA. Error bars represent SEM.
(C) Kinetic course of averaged Frex-Mit and Frex ratio changes in the presence of 0.4 mM AOA, measured by confocal microscopy. Error bars represent SD.
(D) AOA blocked the glucose-dependent increase of mitochondrial NADH. Frex-Mit fluorescence excited at 485 nm was measured 30 min after glucose supplementation. Error bars represent SEM. See also Figure S4.