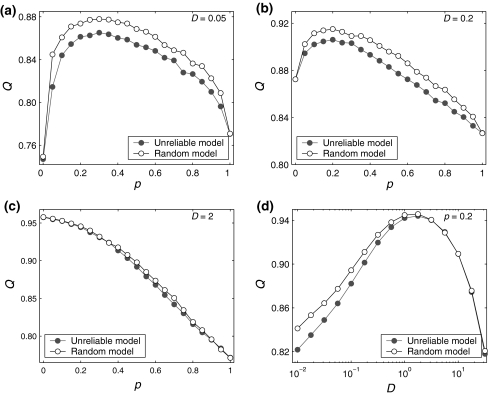
Fig. 6.
Comparisons on the encoding performance between our considered neuronal network (unreliable model) and the corresponding random neuronal network (random model). (a–c): The value of Q versus p for three typical noise intensities. Here D = 0.05 (a), D = 0.2 (b), and D = 2 (c). d The value of Q as a function of D, with p = 0.2. In all cases, we set  nS, τs = 5 ms, k = 8

