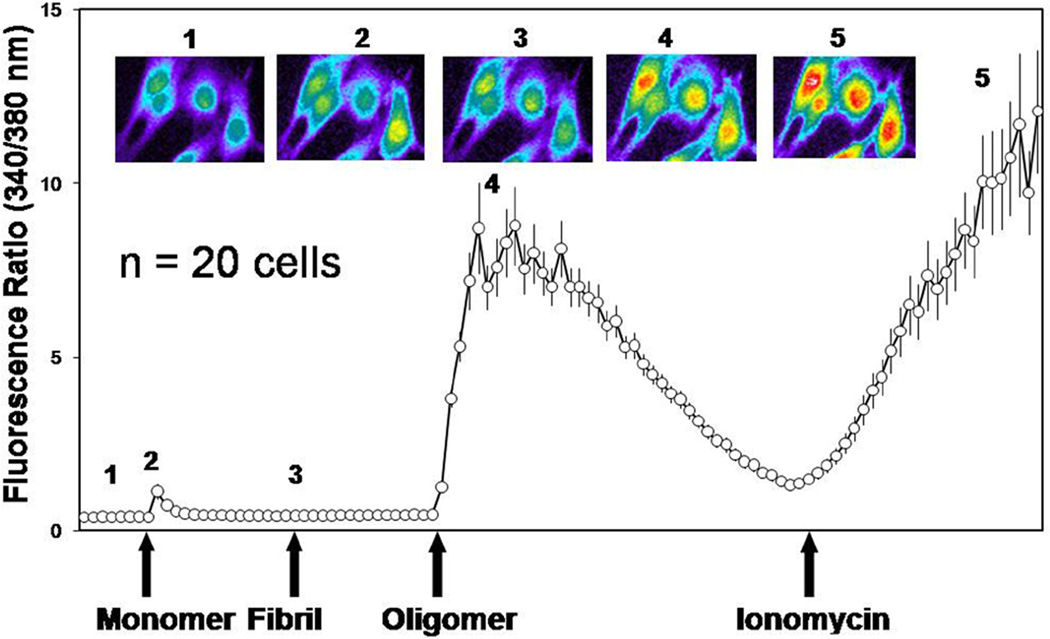
Figure 1. αSyn oligomers, but not monomers or fibrils, increases intracellular Ca2+ levels in SY5Y cells.
Graph showing a 35 min time course of Ca2+-dependent fluorescence recorded and averaged from 20 fluo-3 loaded SY5Y cells in response to consecutive application of αSyn monomers, fibrils, and oligomers (2 µM for 10 min each). Cells were challenged with ionomycin (2 µM) at the conclusion of the experiment. Each point represents the average of the 340/380 nm readings from 20 individual cells. Representative images (top) depict the response of 4 individual cells at the time points indicated by the corresponding number on graph. Warmer colors correspond to a higher level of fluorescence.

