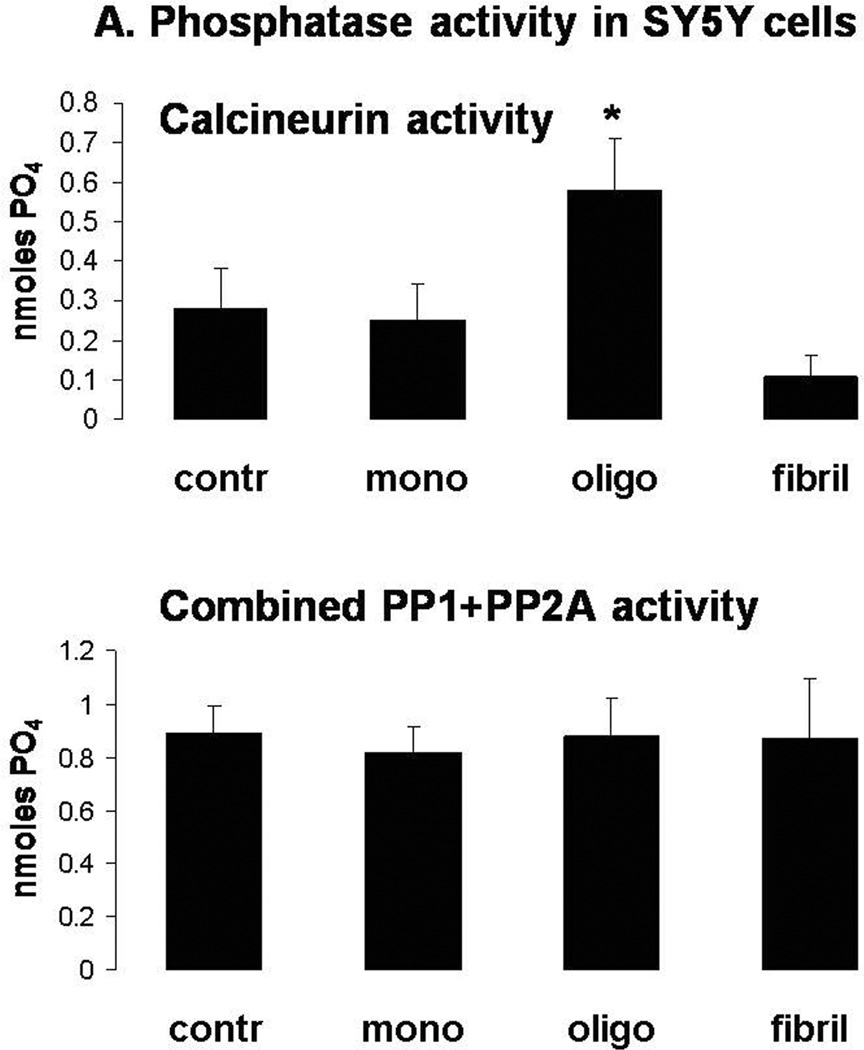
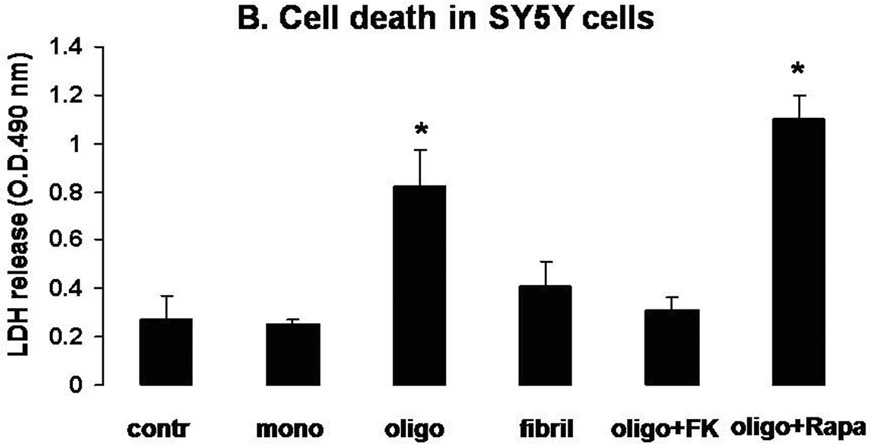
Figure 2. Selective induction of CaN activity and CaN-dependent cell death by oligomeric αSyn in SY5Y cells.
A. CaN (top) and combined PP1+PP2A (bottom) activity in SY5Y cells treated for 24 h with 2 µM αSyn monomers, oligomers or fibrils. Graph is representative of 2 independent experiments returning similar results. n=3 independent measurements per condition; *: p<0.05 vs. control group (ANOVA).
B. LDH release in the culture medium of SY5Y cells treated for 24 h with 2 µM αSyn monomers, oligomers or fibrils. Separate dishes of oligomer-treated cells were additionally treated with FK506 (10 µM) or rapamycin (10 µM). Graph is representative of 2 independent experiments returning similar results. n=4–6 independent measurements per condition; *: p<0.01 vs. control group (ANOVA).


