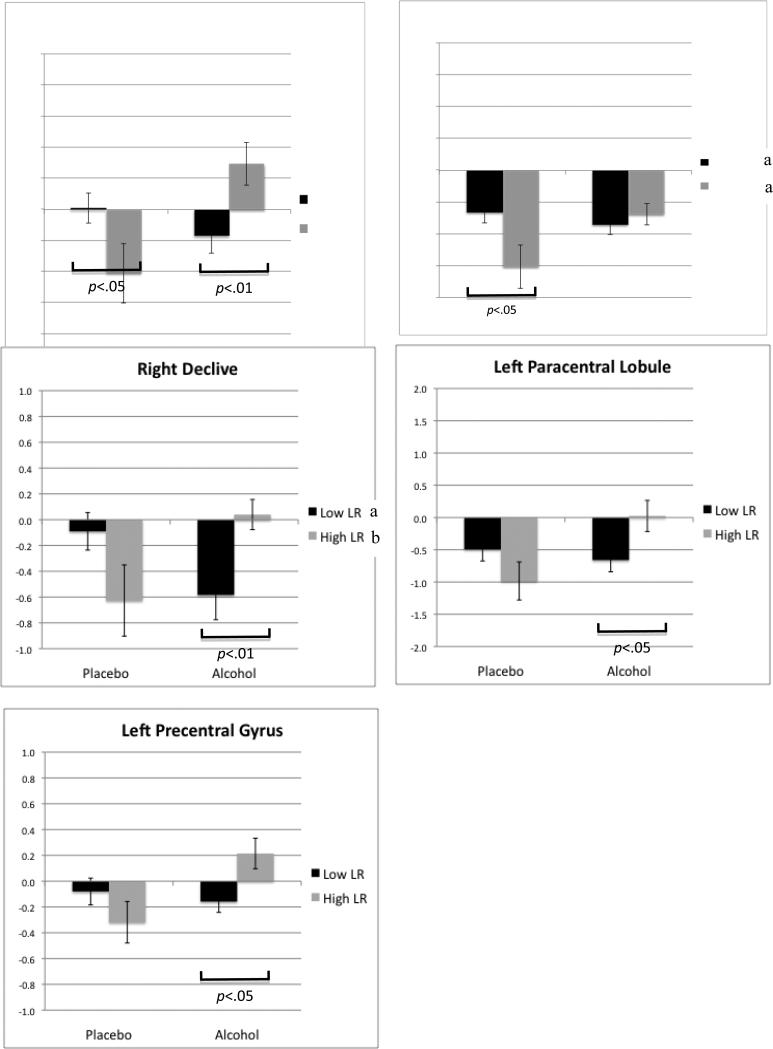
Figure 4.
Graphs with standard error bars for each significant group by condition interaction in BOLD signal contrast for erroneous relative to correct response trials (p<.05, clusters≥1344 μl). Significant differences across high and low LR groups with placebo and with alcohol conditions are indicated with a bracket under the bars. Significant differences within each LR group across alcohol and placebo conditions are noted in each graph's legend (a p<.05, b p<.01).

