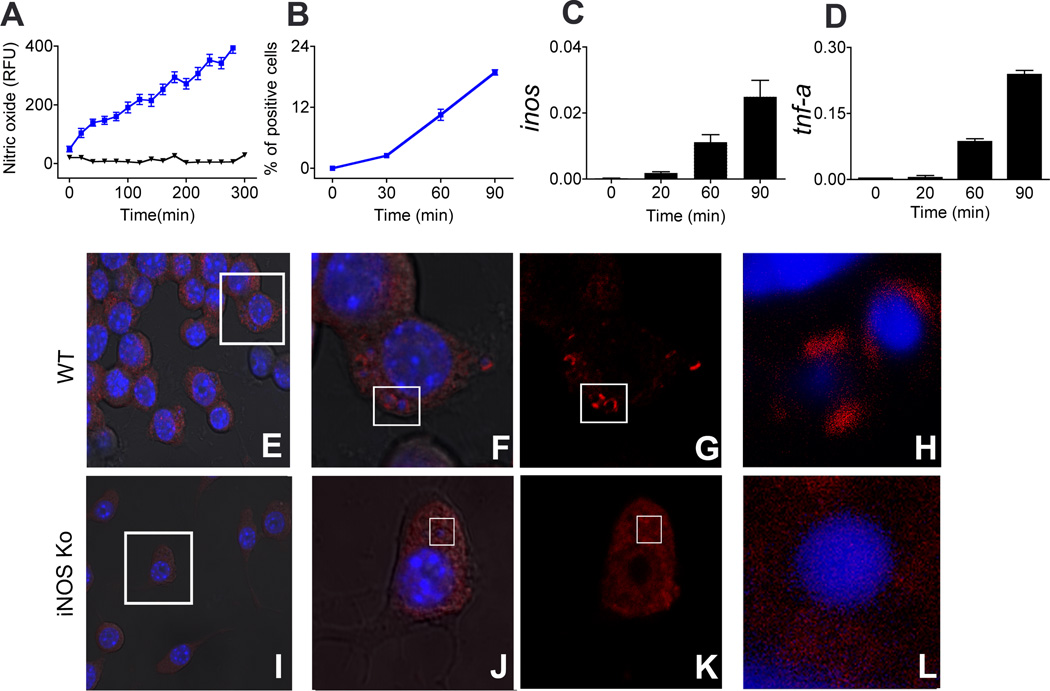
Fig. 3. GBS induces nitric oxide early during phagocytosis that in turn nitrate proteins at phagosome, iNOS dependently.
A; BMDM were followed for nitric oxide production with (blue) and without (black) GBS phagocytosis in real time live cell imaging for indicated time using fluorescent nitric oxide indicator DAF-FM DA. Fluorescence intensities were calculated using Image J for 20 cells per experiment. Data demonstrated is a representative cell out of three independent repetitions each. B; BMDM were stimulated with GBS and fixed at different time intervals, iNOS protein formation was measured by FACS. C&D; Kinetics of transcriptional activation of inos (C) and tnf-α (D) upon stimulation with GBS. Data is mean ± SD. E–L; WT (E–H) and iNOSKo (I–L) BMDM were stimulated with GBS for 30 min, and stained intracellularly for nitrated proteins using anti-nitrotyrosin antibody (Red). FG and JK is magnification from inset in E and I respectively. H&L are magnification of inset in FG and JK respectively. Bacterial and cell nucleic acid was stained with Hoechst (blue); H is turned 90° and magnified from inset in G.

