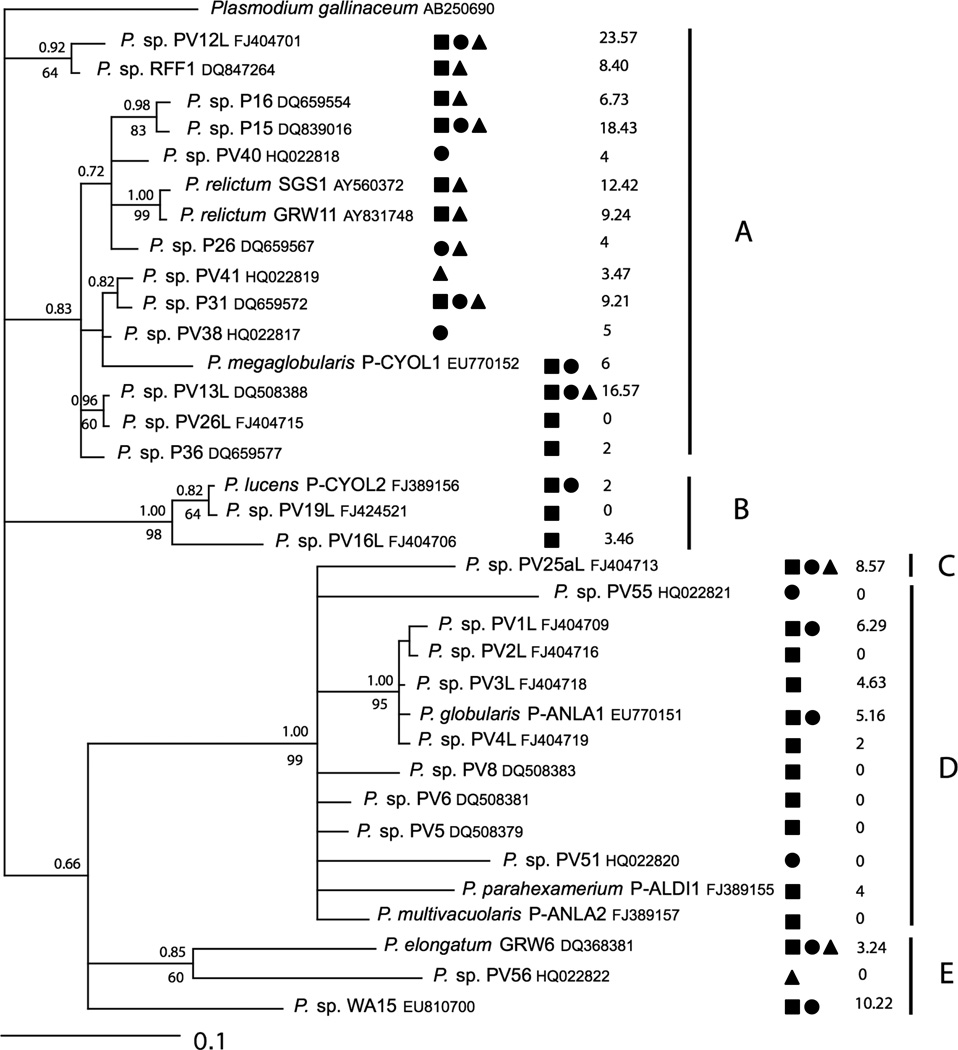
Figure 1.
Phylogenetic relationships in a consensus tree of the 34 Plasmodium lineages found in the three communities of birds based on cytochrome b sequences. Plasmodium gallinaceum was used as the outgroup. GenBank accession numbers of all sequences are indicated. Numbers located on the top of the branches indicate Bayesian probability values and below, ML bootstrap support (100 replications, only values above 50% are shown). Symbols depict the different habitats (square: lowland rainforest; circle: highland forest; triangle: fynbos). The STD index is given for each lineage. The bars indicate three groups of parasites (A: host generalist; B: host specialist; C: host specialist).

