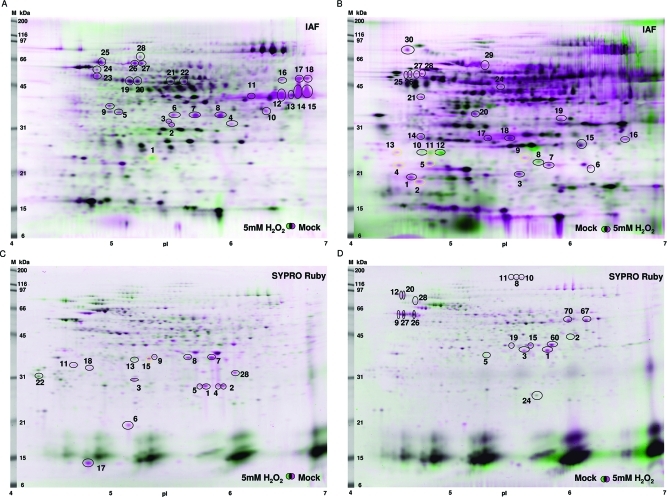
Figure 3.
Detection of redox-sensitive proteins upon H2O2 treatment. IAF labeling images (for the IAF labeling methods) or SYPRO Ruby stained images (for the BIAM tagging methods) from oxidant-treated samples and control samples were pseudocolored and superimposed. Differentially labeled spots (marked by circles in black or yellow) were numbered and excised for MS identification. The MW markers and pI markers are indicated. The yellow circled spots were not identified by MS analysis while the black circled spots yielded positive identification. The images are based on the results from (A) direct IAF labeling, (B) blocking-IAF labeling, (C) direct BIAM tagging, and (D) blocking-BIAM tagging. For each method, three biological replicates were conducted and a representative superimposed image is presented.

