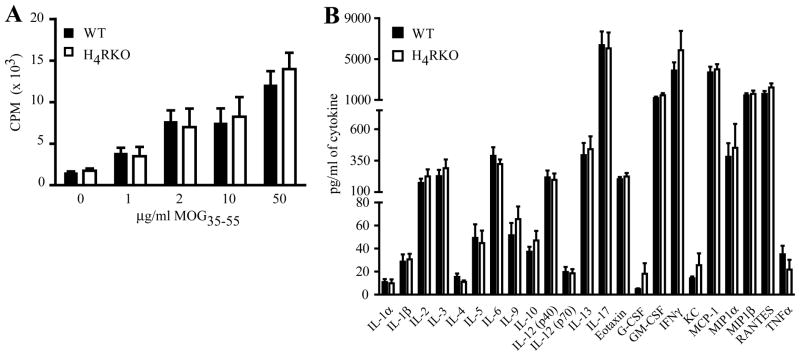
Figure 2. Ex vivo Ag-specific T cell proliferation and cytokine/chemokines profiles of MOG35-55-CFA-PTX-immunized WT and H4RKO mice.
(A) Ag-specific T cell proliferative responses were evaluated by [3H]-thymidine incorporation (n=6 per strain). Mean cpm ± SD were calculated from triplicate wells. The significance of differences was calculated by Two-Way Analysis of Variance. (B) Protein production by MOG35-55-stimulated splenocytes from WT and H4RKO mice. Spleen and DLN cells from d10-immunized mice were stimulated with MOG35-55 for 72h and culture supernatants were analyzed for protein levels by Bio-Plex. Cytokine production in the absence of MOG35-55 was below detection limits. Significance of differences in T cell proliferation or cytokine production was determined using Mann-Whitney test, and Bonferroni’s corrected p-value for multiple comparisons.

