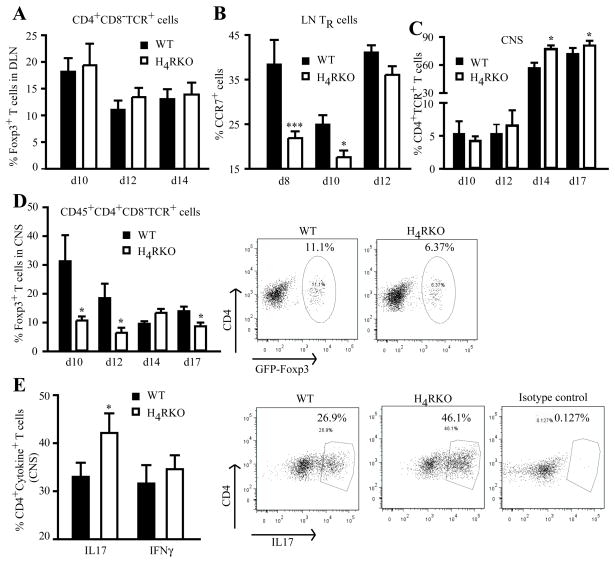
Figure 4. Reduced frequency of Foxp3+ TR cell and increased Th17 cells in the CNS of immunized H4RKO mice.
Flow cytometric analysis of the frequency of CD4+CD8−TCRβ+Foxp3+ TR cell in DLN and spleen (A) and percentage of TR cells expressing CCR7 (B), and percentage of TR cells (D) or Th17 (E) in CNS-infiltrating MN cells of immunized WT and H4RKO mice. (C) Percentage of total CD4+TCR+ T cells infiltrating the CNS of immunized mice. Statistical significance was determined using the Mann-Whitney test (*p<0.05). Flow cytometric data represent the mean ± SEM of 5–8 individual mice (at each time point).

