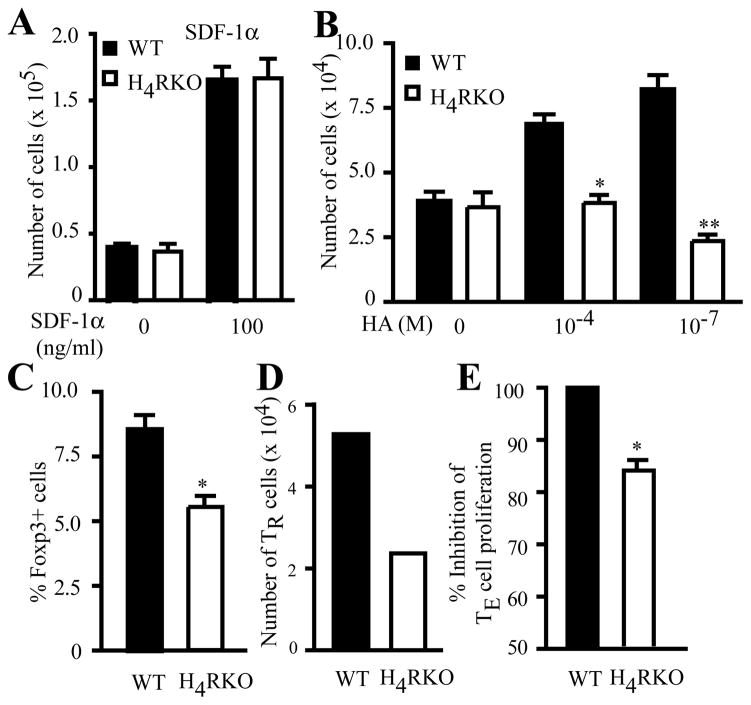
Figure 5. H4R positively regulates TR cell chemotaxis and suppressive activity.
Total CD4+ T cells (A–C) or sorted TR cells (D) from d10 immunized WT (black bars) and H4RKO (white bars) mice were subjected to migration assay using either 100 ng/ml SDF-1α(A) or 10−4 M and 10−7HA (B). (C) Migrated cells were stained for identification of Foxp3+ TR cells and % of TR cells from the total migrating cells is shown. (E) WT- or H4RKO-CD4+GFP−Foxp3− responder cells were cultured with WT irradiated spleen cells and co-cultured at 0.5:1 (TR:TE) ratio with WT- or H4RKO-CD4+GFP+Foxp3+ TR cells, respectively. Significance of differences was calculated using Mann-Whitney test (*p<0.05; **p<0.01). (A) and (B) are the average of 3 independent experiments. (D) is representative of 2 independent experiments. (E) is the average of 3 independent experiments.

