Figure 4.
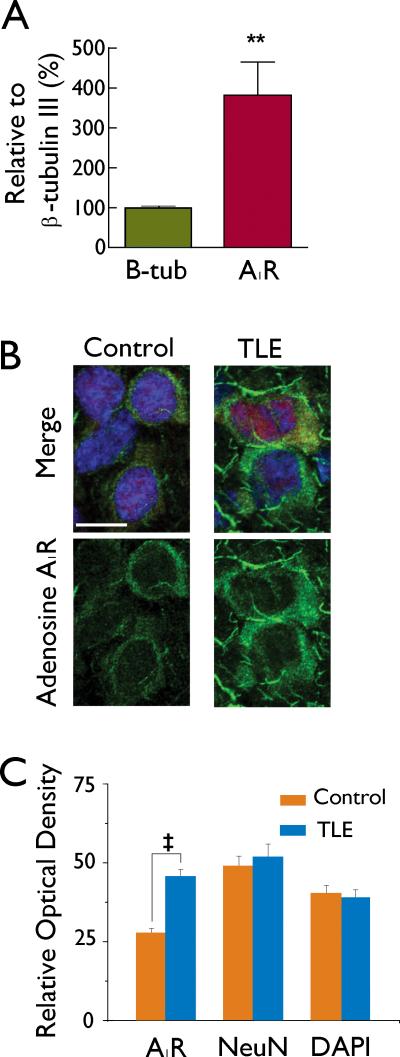
mEC layer II adenosine A1 receptor expression is increased in TLE. A: qPCR of the adenosine A1 receptor isoform on excised mEC layer II tissue from control and TLE tissue reveals a 387 % increase in the adenosine A1 receptor subtype as compared to control levels. B: Immunolabelling intensity for the adenosine A1 receptor (green, lower traces) are increased in mEC layer II TLE tissue as compared to control tissue while immunolabelling intensity for NeuN (red, shown in Merge) and DAPI (blue, shown in Merge) remain unchanged. Scale bar is 20 μM. C: Bar chart showing the cumulative relative optical density of immunostaining for all cells examined. Bars represent means ± S.E.M. t P<0.001.

