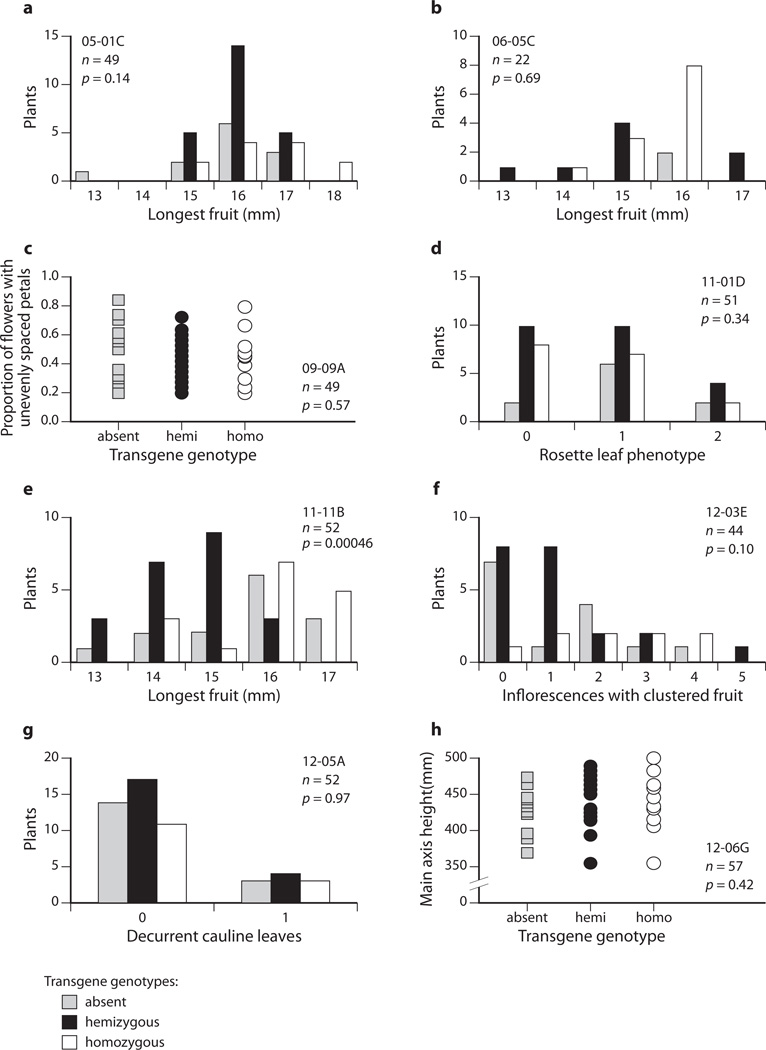
Fig. 4.
Cosegregation analyses of T2 families. Graphs (a–h) show phenotype distributions by genotype in T2 families. Each T2 family was derived from a T1 line that had shown a repeatable phenotype and was inferred to contain one transgene locus, except for 06_05C, which produced a smaller proportion of kanamycin resistant offspring than expected from a single-locus insertion line (see the Results section). Clone name, sample size of T2 family (n), and P-value result of a one-way ANOVA which tested genotypes for differences in phenotype are indicated in each graph. T2 plants in the family from clone 11_01D (D) were scored qualitatively for rosette leaf twisting as follows: 0, three or fewer leaves with slight twisting; 1, four or more leaves with slight twisting; 2, four or more with strong twisting. Seven of eight cosegregation experiments, (a–d, f–h), did not produce a significant result. However the family derived from clone 11_11B (e) did reject the null hypothesis because hemizygous T2 plants had shorter fruit than either wildtype or transgene homozygote plants (corroborated by experiments shown in Fig. 5 and Supporting Information Fig. S3). Transgene genotypes: grey, absent; black, hemizygous; white, homozygous.

