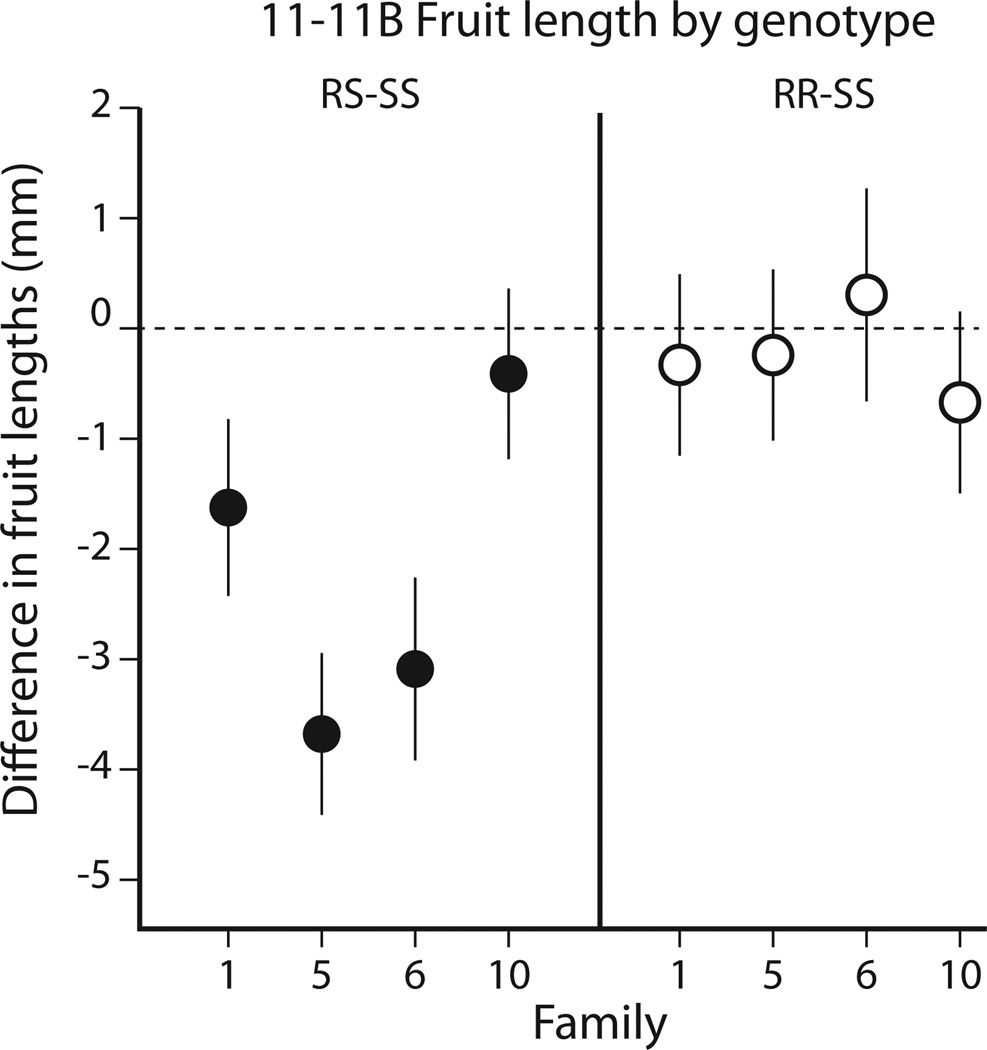
Fig. 5.
Cosegregation analysis of four independent T2 families verifies the overdominant short fruit effect of clone 11_11B. The plot compares transgene hemizygous (left panel) and transgene homozygous (right panel) mean fruit lengths versus transgene-absent mean fruit length. The mean fruit sizes are plotted with 95% confidence intervals. The four estimates per panel are from cosegregation data generated by four independent T2 families. Of the four independent families (mean n = 56 plants), three repeated the transgene overdominant effect observed for clone 11_11B in Fig. 4. For all four lines, the ratio of inferred wildtype, transgene-hemizygous, and transgene-homozygous T2 plants did not deviate significantly from 1:2:1, corroborating that these four T1 lines each have a single transgene locus.

