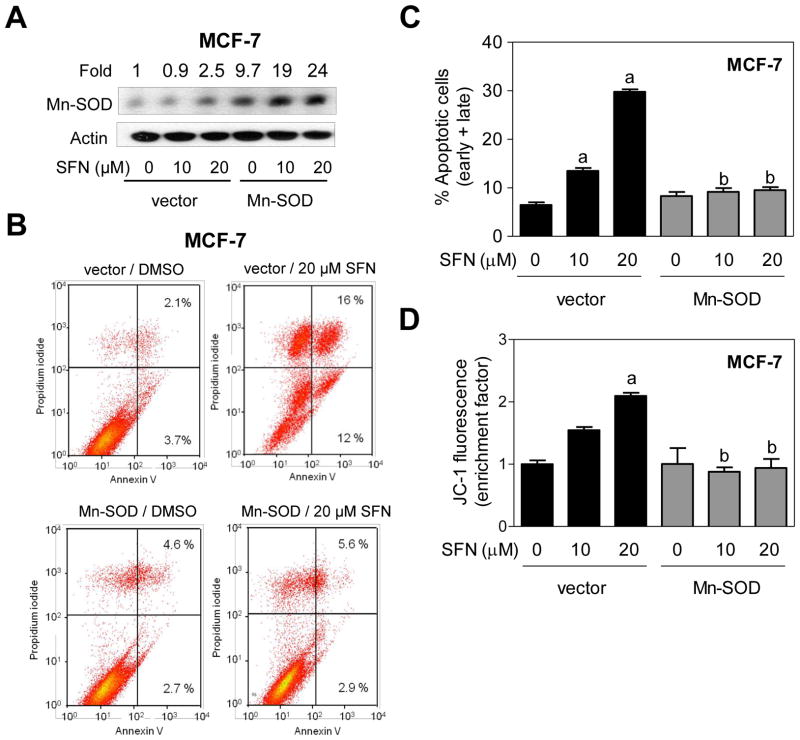
Fig. 3.
Manganese-superoxide dismutase (Mn-SOD) overexpression attenuated D,L-sulforaphane (SFN)-induced apoptosis in MCF-7 cells. A: Immunoblotting for Mn-SOD using lysates from MCF-7 cells stably transfected with empty vector or vector encoding for Mn-SOD and treated for 24 hours with dimethyl sulfoxide (DMSO; control) or the indicated concentrations of SFN. Numbers above the bands represent densitometric quantitation of change in protein level relative to empty vector transfected cells treated with DMSO. B: Representative flow histograms depicting apoptotic fraction in MCF-7 cells stably transfected with empty vector or vector encoding for Mn-SOD and treated for 24 hours with DMSO (control) or 20 μM SFN. C: Quantitation of % apoptotic fraction (early + late apoptotic cells) in MCF-7 cells stably transfected with empty vector or vector encoding for Mn-SOD and treated for 24 hours with DMSO (control) or the indicated concentrations of SFN. D: Flow cytometric quantitation of monomeric (green) JC-1 fluorescence in MCF-7 cells stably transfected with empty vector or vector encoding for Mn-SOD and treated for 24 hours with DMSO (control) or the indicated concentrations of SFN. For quantitative measurements (panels C and D) results are expressed relative to DMSO-treated empty vector cells (mean ± SD, n = 3). Significantly different (P<0.05) compared with arespective DMSO-treated control for each cell line, and bbetween SFN-treated empty vector transfected cells and SFN-treated Mn-SOD overexpressing MCF-7 cells by one-way ANOVA followed by Bonferroni’s test. Each experiment was done at least twice and representative from one such experiment are shown.

