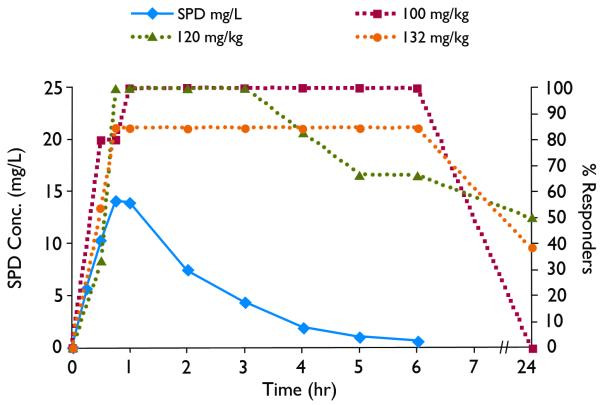
Figure 10.
Pharmacokinetic-pharmacodynamic (PK-PD) correlation. Solid line indicates plasma concentrations following ip administration of SPD (60mg/kg) to rats. Dashed lines indicate % responders to SPD administered 20min after seizure onset, measured as the number of “protected” rats (rats without soman-induced seizures) divided by total number of rats tested at each time point.

