
Figure 7.
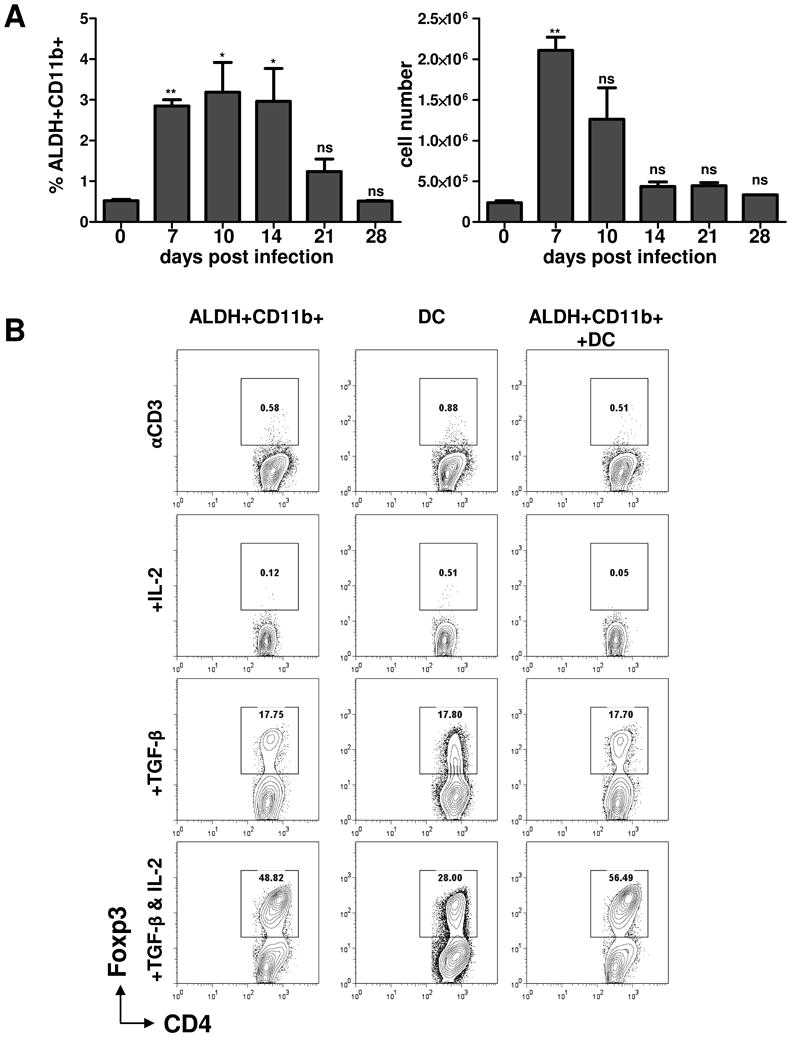
Peripheral Treg cell conversion by ALDH+CD11b+ and CD11c+ DC cells.
(A) The relative (left panel) and absolute (right panel) counts of ALDH+CD11b+ cells at the indicated time points after T. gondii infection. The appearance of ALDH+ cells in response to T. gondii infection was analyzed by flow cytometry on days 0, 7, 10, 14, 21, and 28 post-infection shown in Figure S4. (B) ALDH+CD11b+ and ALDH-CD11c+ cells were sort-purified from spleens of T. gondii-infected mice on day 7 post-infection and were mixed with sort-purified Foxp3GFP- CD4+ T cells in the presence of αCD3 alone or in combination with IL-2 and TGF-β. T cell Foxp3 expression was examined by flow cytometry after 3 days of culture. Plots are gated on CD4+ cells, and the percentages of Foxp3+ cells are shown. The data shown are representative of three experiments. * P< 0.1; ** P< 0.01.