Figure 6.
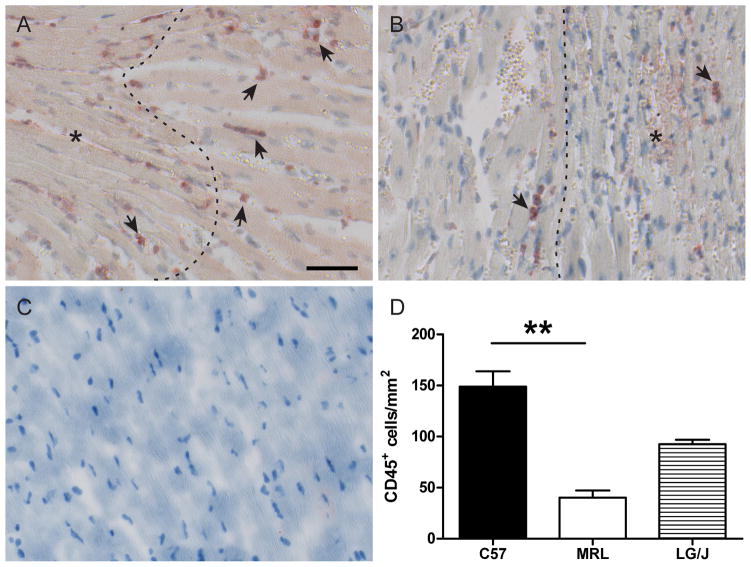
CD45+ cells (arrows) in the infarct border zone of C57 (A) and MRL (B) hearts 2 days post-MI (C57 n = 6, MRL n = 5). Dotted lines denote the approximate infarct boundary. An asterisk marks the injured region. A representative uninjured control is shown in panel C. There were significantly more CD45+ cells/mm2 in the C57 infarct border zone than in the MRL border zone (P < 0.01) (D). There were no statistically significant differences between LG/J hearts (n = 4) and the other groups. Bar = 50 μm. **, P < 0.01.

