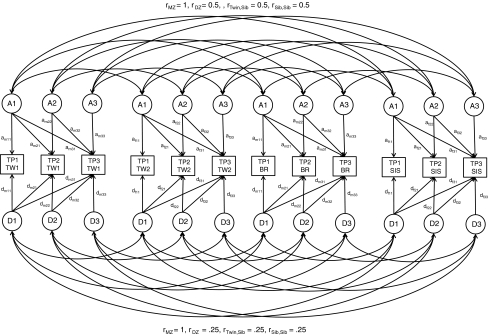
Fig. 1.
Path diagram for longitudinal ADE model on thought problems (TP) for three age groups. The figure shows data from an opposite sex twin pair (TW1 = male, TW2 = female) and their two siblings (BR, brother, SIS, sister). The rectangles represent the log-transformed TP sum-scores (TP1 = TP measured at ages 12–18, TP2 = 19–27, TP3 = 28–59). The circles the latent unmeasured factors (A, additive genetic effects; D, dominant genetic effects; E, non-shared environmental effects, and is omitted in the figure for simplicity, but is modeled in a similar way). In parameter subscripts, m stands for male and f stands for female

