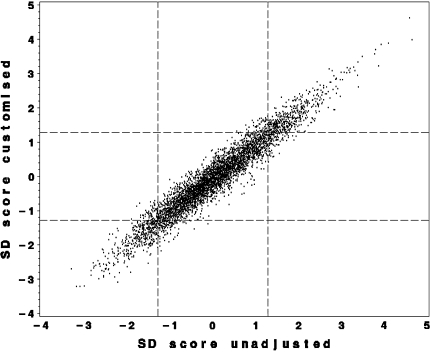
Fig. 3.
Unadjusted reference and individually customised references. Relation between SD score obtained by the unadjusted reference (x-axis) and by individually customised references (y-axis). Reference lines are drawn at P10 and P90. Standard deviation (SD) scores were computed by taking the difference between an observed and a predicted estimated fetal weight, divided by the residual SD corresponding to the gestational age. The various predictions using both methods lead to various SD scores and, in consequence, to different classifications of the fetus as “too small” (SD score <1.28 = P10) or “appropriate”

