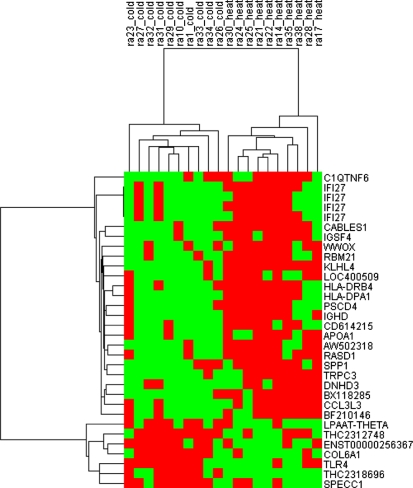
Fig. 1.
Cluster diagram of the expression of 29 significantly expressed genes in 10 RA patients with heat patterns and 10 RA patients with cold patterns. Patients are indicated as vertical column headings, and gene symbols of transcripts are given in horizontal rows. Red represents relative expression greater than the median expression level across all samples, and the green represents an expression level lower than the median

