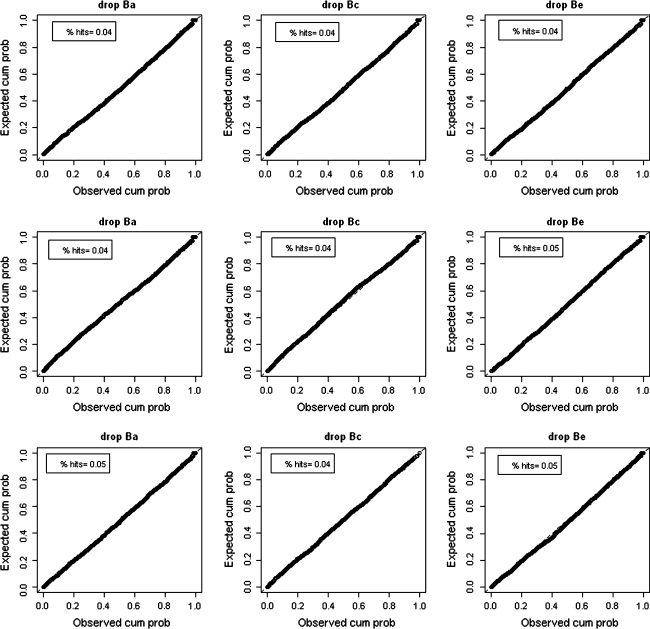
Fig. 4.
PP-plots for the extended univariate moderation model in Simulation study 2, in which T and M are correlated exclusively via A (upper part), exclusively via C (middle part), or exclusively via E (lower part). Deviations from the 45° line show whether the use of the regular χ2(1) test would result in conservative (above the line) or liberal (below the line) decision. % hits denotes the percentage of likelihood-ratio tests smaller than the critical value 3.84 (i.e., significant given α = .05). A hit rate of .05 is expected given α = .05, and given that moderation effects were absent in the data. Hit rates outside the .04–.06 range should be considered incorrect (i.e., significantly too low or too high)

